Docker Container Statistics Daemon
A daemon process that continually executes docker stats, aggregates the output and publishes to QuestDB periodically. Statistics are continually polled to ensure that we can capture temporary spikes, short scheduled job runs, etc.
This project builds on the work started in Docker Container Statistics and enhances it to run as a persistent process, rather than a scheduled task that is executed at the desired frequency (which only provides point-in-time information).
Optionally, the process also reports on the available free disk space for a configured set of disks on the host machine.
Command line arguments
The following arguments are supported for running the process. Of these the node argument is required, the others are optional as they have default values.
-n|--nodeThe host name to add to the published data. Generally the name of the host docker daemon is running on. This goes into thehostcolumn in QuestDB and can be used as variables in Grafana dashboards.-m|--modeThe mode to use when publishing to QuestDB. Defaults toavg.avgUse average values for the aggregated data and publish the average periodically.maxPick the maximum value from the aggregated data and publish. I primarily use this option, as I am more interested in seeing the spikes or worst cases scenarios being reported than in the averaged numbers.
-q|--questdbThe QuestDB host to publish to. Defaults tolocalhost.-s|--stats-tableThe series name to publish to. Defaults tocontainerStats.-i|--intervalThe interval in minutes for which statistics are aggregated. Defaults to5minutes. Must be between1and15(I do not think larger values are useful, and there is not that much benefit in trying to reduce the amount of data stored in QuestDB).-t|--transport-protocolThe QuestDB ILP transport protocol to use. Defaulttcp.tcpPublish to QuestDB over TCP/IP.httpPublish to QuestDB over HTTP.httpsPublish to QuestDB over HTTPS.
-p|--portThe port on which the QuestDB ILP service is listening. Default9009.-w|--watchdogLinux only!. Enable or disablesystemd watchdognotifications. If enabled, the systemd service unit must haveWatchdogSecset.enabledThe default option. Enable sending watchdog notifications at the recommended interval of roughly half the configured timeout value.disabledDisable sending watchdog notifications. This turns off all interactions withlibsystemd. Primarily meant to be used when the process is controlled via traditional shell scripts or similar mechanisms, and not undersystemd.
-b|--block-deviceOptional list of disk/volume/block device names for which disk usage statistics are to be captured. Specify multiple times for multiple disks.--block-device '/dev/nvme0n1p1' --block-device '/dev/nvme2n1'-d|--disk-tableThe series name to publish disk information to. Defaults todiskStats.
Environment Variables
Process log level can be controlled using the standard RUST_LOG variable. Process logs at the info and debug levels. For standard deployments, info level logging should suffice.
Build
Standard cargo project, so build using cargo build --release. For deployment, I prepare a statically linked executable building for aarch64-unknown-linux-musl target. I usually build the deployment target on an Ubuntu VM running on Parallels. There is also a Dockerfile that can be used to build the executable. Once the image has been built, run the image with a volume mount and copy the executable to the local directory.
Note: I do not use the cargo package as it is an older edition 2021 as opposed to the current 2024.
Run
The process will typically be run as a service through systemd. The service unit sample file can be used as a template for setting up the service.
The latest executable for Linux on ARM64 can be downloaded from the project Releases page. The container-statsd.bz2 file is the compressed executable. This is the same file we download on to our EC2 hosts and run via systemd.
Note: The user under whom the service is configured will need to be enabled as a lingering user. If not, services started by the user will not survive the user logging out. This will also trigger an infinite stop/start loop for the service (unless you configure the maximum number of restarts).
Note: The process publishes data using ILP over TCP/IP. The QuestDB TCP port (default 9009) must be open and accessible from the hosts where the process is installed.
Alternate
A traditional shell-script approach may also be followed to run the process. The following script can be used to control the daemon.
You can have a systemd timer check the process and restart if not running (we have yet to run into an issue with the process aborting).
QuestDB Table
The table schema as generated from the ILP data is shown below.
Disk Statistics Table
The optional disk statistics that are captured has the following schema:
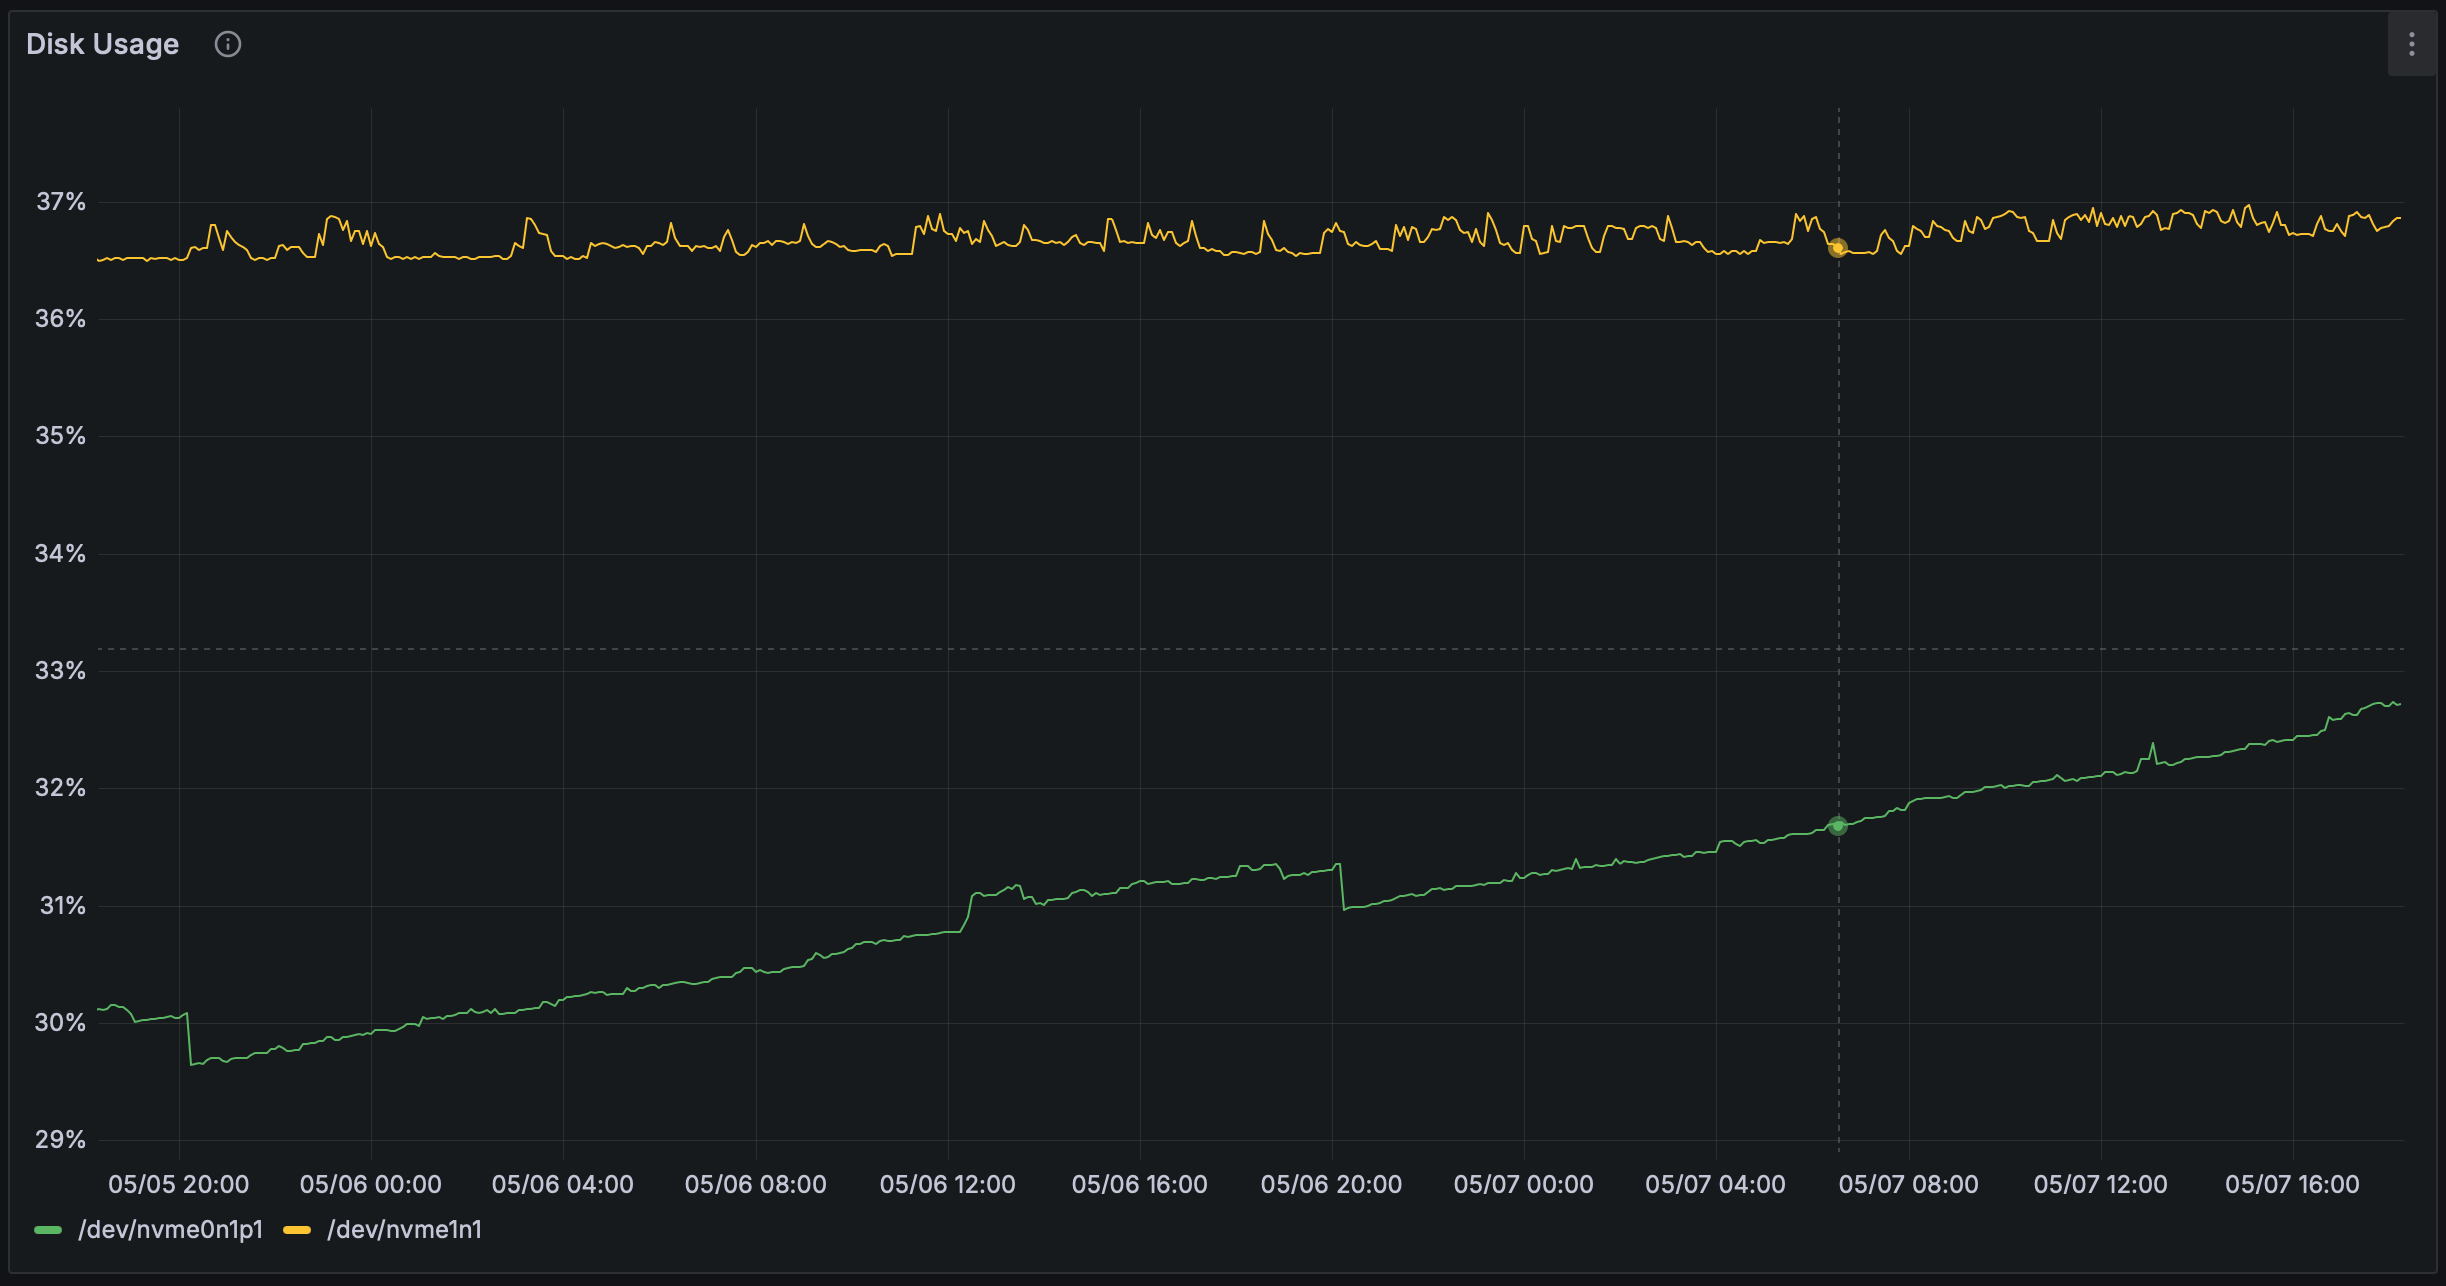
Note: The percentage_use column is mis-named. This column captures the percentage of available space against the total space. Hence, this column captures the percentage available, and not the percentage used. When plotting the data, you will need to do a (100.0 - percentage_use) computation in the query.
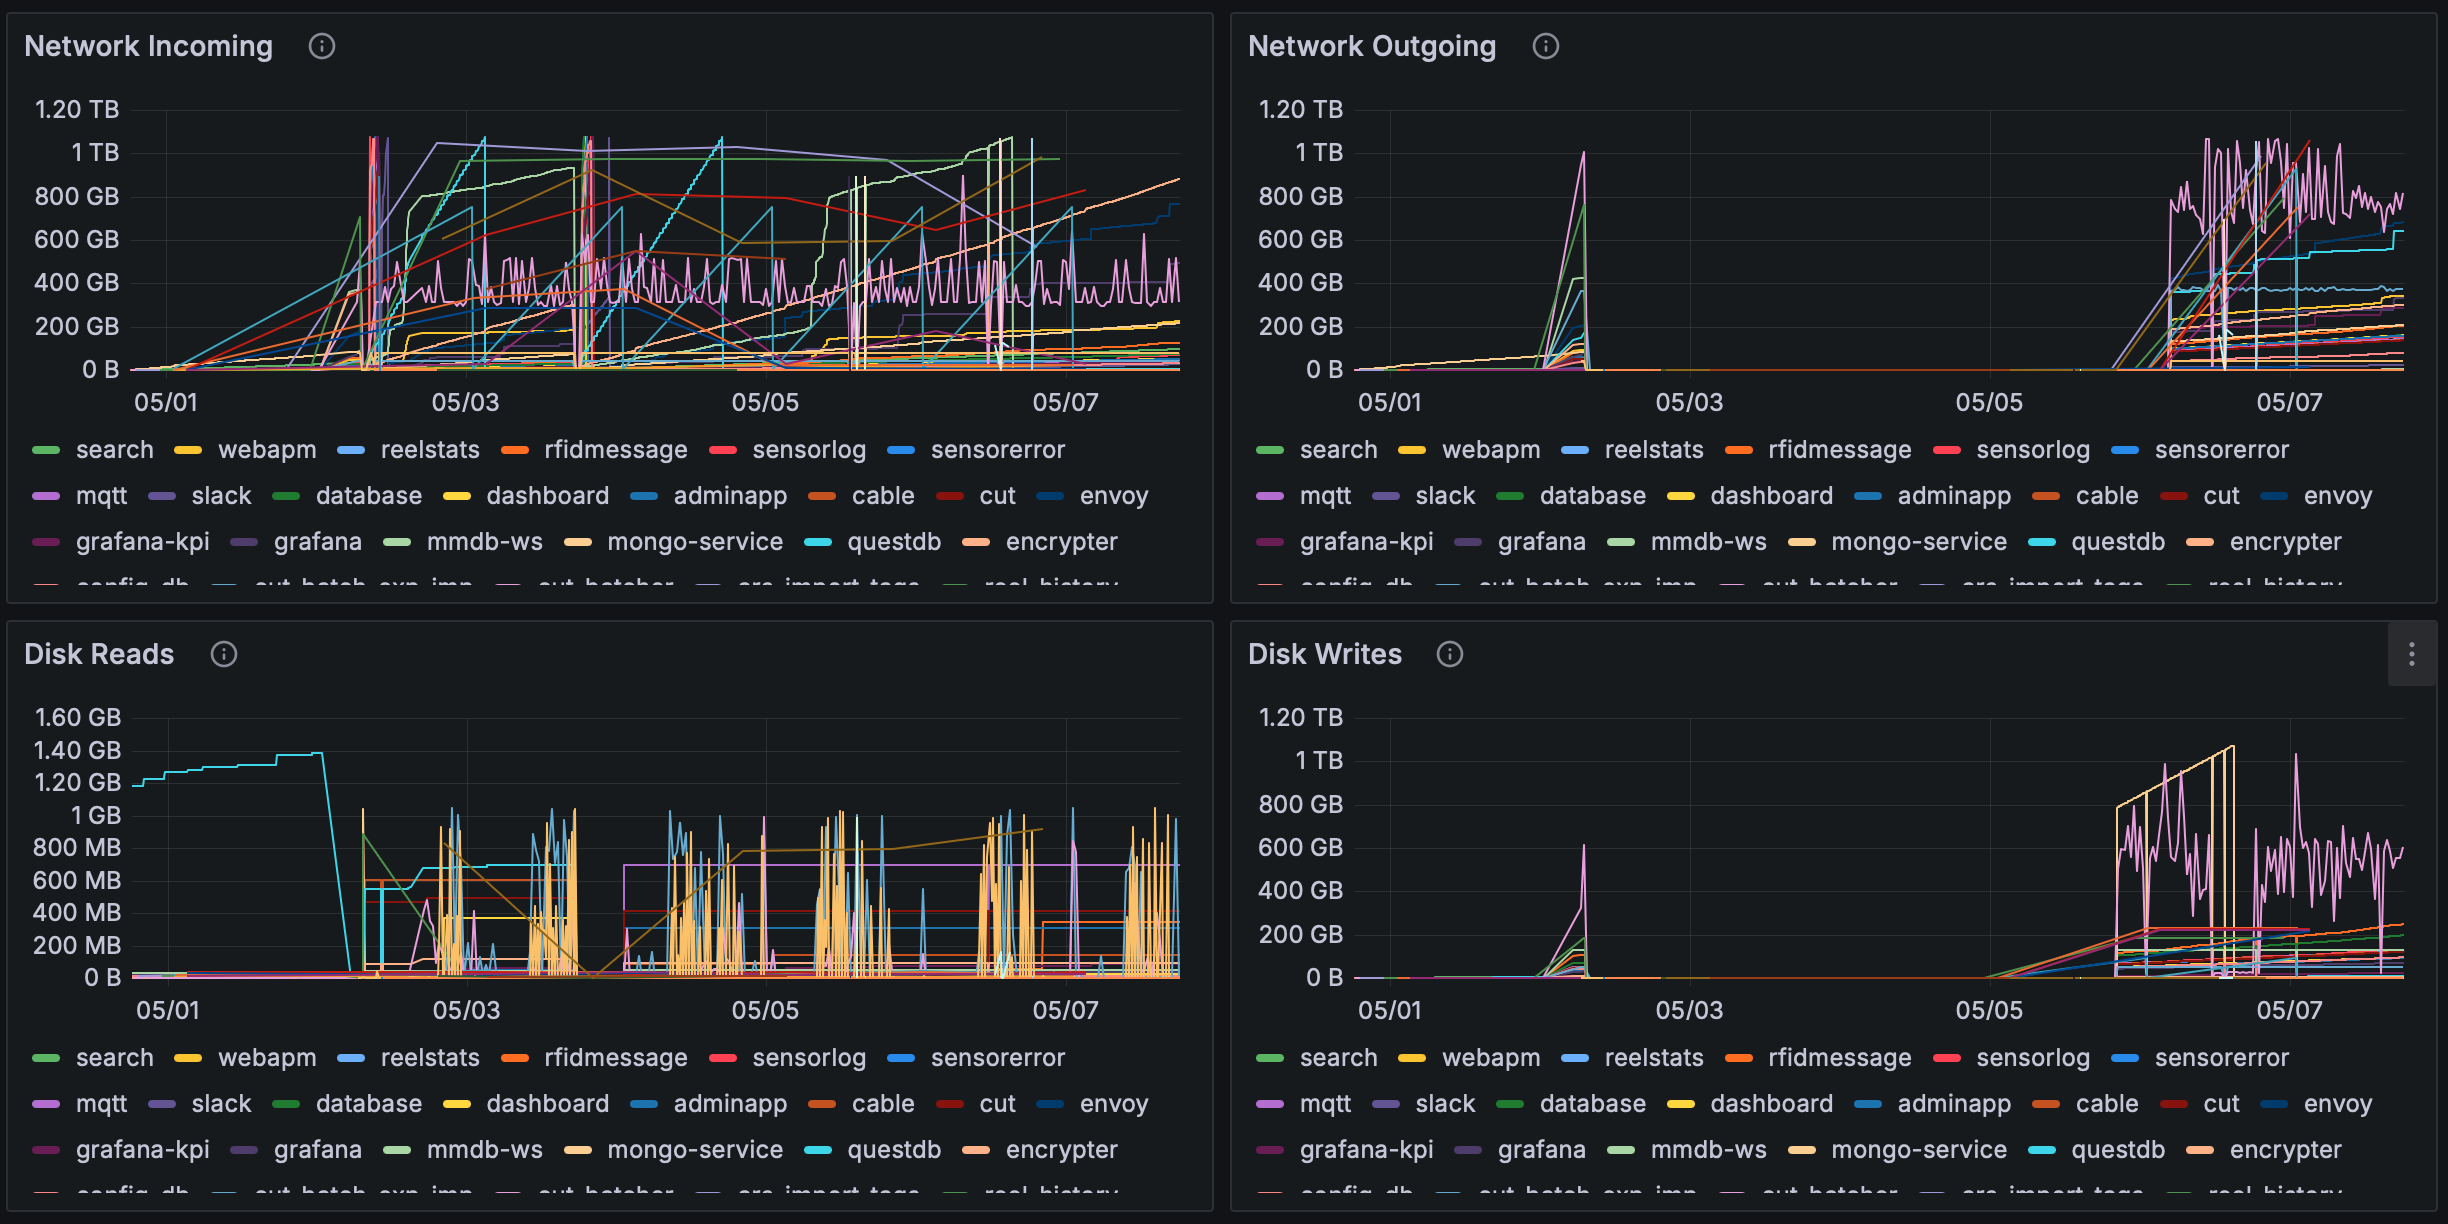
The image below shows IO (block device and network) statistics captured from background processes (daemon and periodic) that run on our system.

The following image shows disk usage percentage from the optional feature.
